In 2019, large swaths of the Midwestern United States were inundated by floods.

Image source: <a src=https://www.npr.org/2019/03/21/705408364/nebraska-faces-over-1-3-billion-in-flood-losses target=”_blank”> National Public Radio - Nebraska faces over 1.3 billion in flood losses.</a>”
What impacts did the flooding have?
You can consider in the impacts of flooding across several domains, including:
- Loss of life
- Financial loss
- Infrastructure damage
- Ecosystem disturbance
Questions:
- Can you think of any other types of impacts these floods might have had?
- Pick two types of impacts. What kind of data would you need to evaluate the extent of the impact?
Have you or anyone you know experienced a flood?
What was that like? What kinds of human impacts did it have? Do you have any photographs?
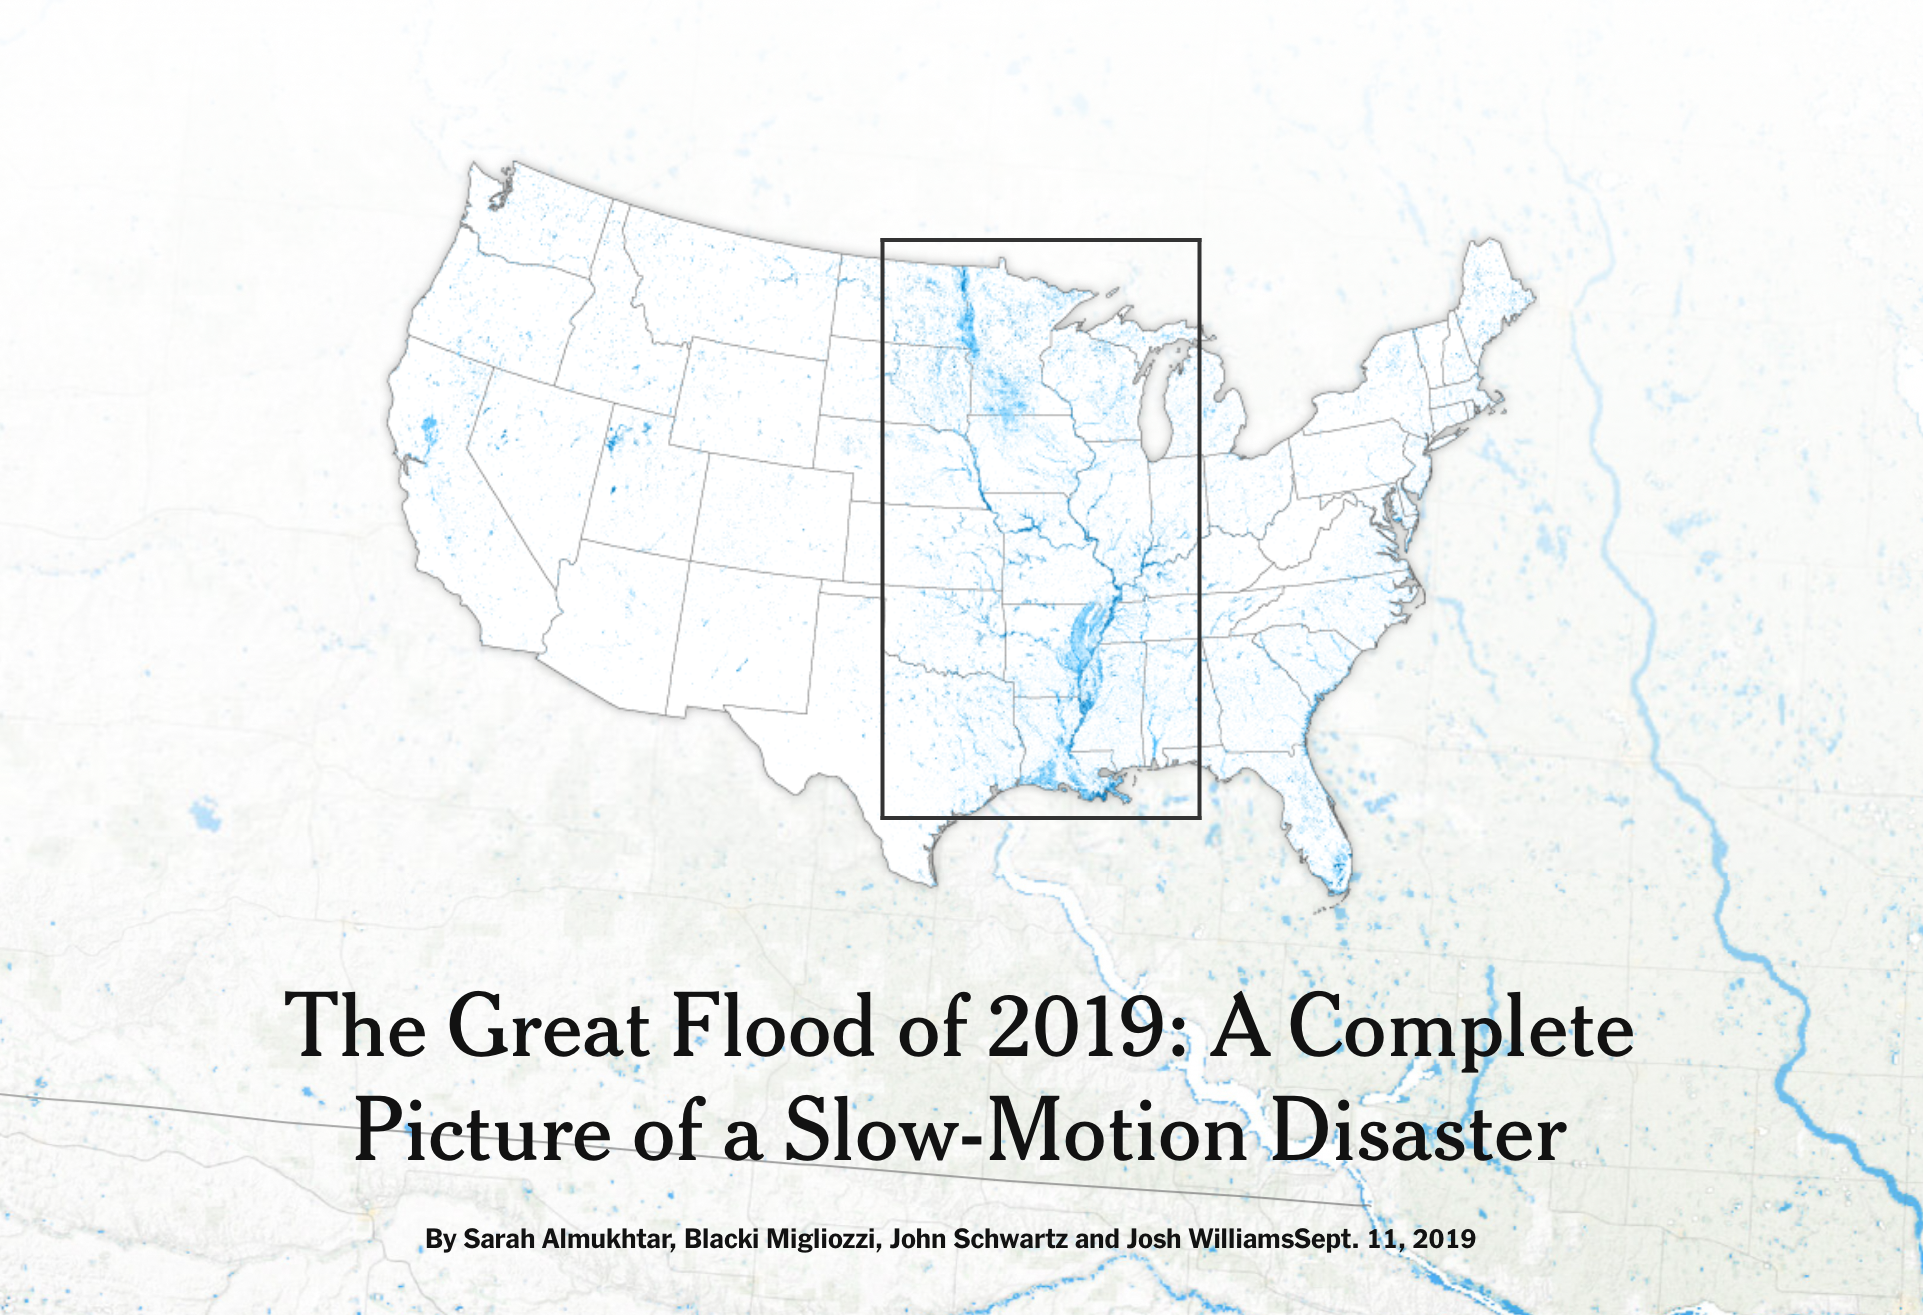
Interactive Reporting from the New York Times highlights the impacts of the flooding across the region
Source: The New York Times
Questions:
- What types of impacts did these floods have on the region’s people, agriculture, and infrastructure?
- Do you notice any issues of equity highlighted in this article? What is an example of a policy measure that could help to mitigate inequity in flood impacts and risk?
- What data did the New York Times use to create their images? Include a citation as if you had used these data yourself.
- What are the advantages and disadvantages of the data analysis and visualization in this article for conveying the effects of inland flooding?
Compare the Missouri River before and during flooding at NASA Earth Observatory
Source: NASA Earth Observatory
Questions:
- Describe the satellite images in this article, as if for alt-text or a screen reader.
- Did you learn anything new about the floods in the Earth Observatory images and article?
- What data did NASA use to generate these images? Include a citation as though you were using the data yourself.
- What are some advantages and disadvantages of the data source used by NASA for this purpose?
Who else has skin in the game? National Flood Service’s take
Check out this article about the Midwestern 2019 floods from an insurance company, National Flood Services.
Questions:
- How can you tell that this article is from an insurance company instead of journalists or scientists?
- Did you learn anything additional from this article that was not present in the other articles?
- Do you trust this source? Are there parts of the article you trust more than others?
- Obviously there’s a potential for bias in this article. What biases might be present in other types of articles or data sources about these floods?
In situ streamflow measurements in Omaha, NE were much higher than normal throughout 2019, but particularly in March
Source: USGS Water Data for the Nation - Monitoring Station on the Missouri River near Omaha, NE
Questions:
- Compare and contrast this in situ information with the remotely sensed images. What are some advantages and disadvantages to these data?
- How can we tell if this level of flooding is “abnormal”?
What caused the 2019 Midwestern Floods?
Questions:
- Did you learn anything about the causes of the flooding in the previous articles?
- What is the difference between proximate and ultimate causation? How does the use of one or the other change the story about this flood?
Consider the difference between susceptibility, hazard, and risk
Susceptibility: what aspects of a location make it more vulnerable to flooding when a triggering event like a large storm occurs? Hazard: what is the likelihood that a natural disaster will occur? (susceptibility + trigger) Risk: what is the likelyhood that a particular level of damage will occur? (susceptibility + trigger + people and infrastructure in the way)
Read this article about guidelines for evaluating susceptibility, hazard, and risk
Questions:
- What are some ways that risk can be mitigated even if we are unable to reduce susceptibilty or hazard of flood events?
Climate change is increasing flood hazards, but did it contribute to these floods?
Source: Yale Climate Connections
Questions:
- What are some ways that we as scientists can evaluate the contribution of climate change to a particular event?
How does the U.S. Government evaluate flood risk?
Questions:
- What are some methods that the USGS uses to account for limited temporal extent of streamflow data?
- Bulletin 17C assumes stationarity of flood flow. Explain, and discuss the advantages and disadvantages of this approach. More info:


